Understanding the performance management chart in Training Peaks: ATL, CTL and TSB explained
In this blog I am going to explain how the Performance Management Chart in Training Peaks - an online training and coaching software – works, and how you can effectively use this to plan and monitor your training loads through the season. I will explain the acronyms ATL, CTL, TSB, TSS and IF and demonstrate how and why these change over time as you train.
I have deliberately avoided going into detail on other related areas (e.g. power, HR) for the sake of this blog's readability. If you do require further clarification, reliable reading can be found on the Training Peaks help site here.
I have deliberately avoided going into detail on other related areas (e.g. power, HR) for the sake of this blog's readability. If you do require further clarification, reliable reading can be found on the Training Peaks help site here.
The Lingo
The Pink Line: ATL (Acute Training Load)
Training load accumulated within the last 7 days. Average TSS for the last 7 Days.
– This can be viewed as an indicator of ‘fatigue’.
– This can be viewed as an indicator of ‘fatigue’.
The Blue Line: CTL (Chronic Training Load)
Training load accumulated 42 days ago and older. Average TSS for the last 42 Days
– This can also be viewed as an indicator of ‘fitness'.
– This can also be viewed as an indicator of ‘fitness'.
The Yellow Line: TSB (Training Stress Balance)
The TSB is the value of the CTL minus the ATL. The higher the ATL, the worse the TSB
– TSB is often substituted for ‘form’.
– TSB is often substituted for ‘form’.
The Blue Dots: IF (Intensity Factor)
An indication of how intense the individual session was. Calculated as the Average Power/Pace divided by the Functional Threshold Power/Pace.
The Red Dots: TSS (Training Stress Score)
A metric to quantify the training stress of each workout either based on HR or power.
You need correct power and HR zones are in your Training Peaks account as you go through your season for the most accurate TSS scores. Your TSS is (simply) Time in hours x (Intesnity Factor)^2 x 100
You need correct power and HR zones are in your Training Peaks account as you go through your season for the most accurate TSS scores. Your TSS is (simply) Time in hours x (Intesnity Factor)^2 x 100
Training Load
Training Load = TSS
Training Volume
The duration or distance of a particular training session.
Training Intensity
Intensity Factor
Training Frequency
The repetition of volume per unit time.
How does this look on Training Peaks?
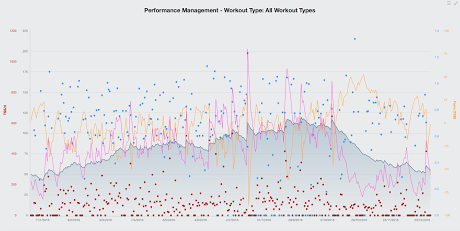
This is an example Performance Management Chart for a runner, so although it is labelled "All Workouts", it is predominantly running.
What are the initial results likely to look like?
You can see that at the start of the year, the CTL was lower (indicating low fitness) and ATL rapidly increased as training began, shortly followed by a steady increase in CTL. With this increase in both short term and long term training load, TSB went into negative figures as a result of fatigue.
Note: A consistently low TSB (poor form) is a direct result of over-training, but as Training Peaks does not take into account other external factors (such as sleep quality, stress levels) which influence your ability to recover and adapt, this real TSB can be either lower or higher than is indicated on this graph. Remember to take this into account when you analyse your data.
After this, the athlete took a bit of an easy week, and got in a good training block which resulted in a continued rise in CTL.
What happens if I stop training?
The last quarter of the of the graph demonstrates what happens as training stops! Though there is some training, we can see how the TSB increases and the fatigue (ATL) drops off and the CTL mirrors it.
Tapering for a race correctly
Tapering for an event depends on the type of event you are doing With training, you are looking to reduce the ATL (Fatigue) without reducing the CTL (It may drop by a little bit) and bring TSB values to a "just positive" value, you can see the athlete's final race at the end of September (before the significant ATL increase). There is a slight CTL drop off. However, the athlete gains form which is an acceptable sacrifice.
Note: be careful to look at your individual disciplines’ performance management charts if you pursue multi sports such as triathlon. Just because you look like you are ‘on form’ on the overall chart, it does not mean you are necessarily ‘on form’ in each sport.
Variation between individuals
How positive does your TSB need to be just prior to a race and for how long? Some people will need just to reach a +10 TSB for only 3-4 days before they perform at their best. Others will need to reach a +30TSB for 3-4 days before they are 'fresh' enough. After a few races, distance and experience, you will start getting to know where you lie on this scale.
Happy training,
Tri Training Harder